Viral Texts
Viral Texts (link here) is a digital humanities project focused on understanding how texts in the 19th century went “viral”. Viral back then was very different from now. Right now, something can go viral through an algorithm that throttles video or article impressions. In the past, the circumstances that were required for such a thing to happen were very different.
The first note I want to take is the type of Digital Humanities Project that this would fall under. Based on the options presented in Miriam Wasner’s video, I think it would fall under Data Visualization. The data and interactive exhibits seem to be down, but the visualization is up and running.
When looking at the available ways the information is presented, there should be a bit more. I think there is supposed to be access to individual pieces of information, but since some of the links are down, the visualization (pictured below) is the most cohesive element.
My Basic Summary and Understanding
There is a 2 minute video summarizing the project, which I think is good to ensure people get the basic understanding of things without having to put in a large time investment. My summary of the summary is that newspapers had a bit of everything. They had entertainment and news on it. They were not protected by copyright the way things are today. A lot of content was reused between newspapers and modified. Text analysis normally used for plagiarization is used to identify similarities between some of the papers and how the circulated content is interconnected.
I have linked it the video below in case anyone wants to see it.
I find the type of data being used is a very interesting topic. There needed to be funding for this project to work. Large databases needed to be searched as well as using previous projects as a backbone. Even though a lot of digital humanities projects don’t have particularly large projects, as we see when things can’t handle large amounts of people accessing it at once or by projects going offline, there is still a reasonable amount of effort and money needed to put it together.
The Project Itself
Here, I have taken a screenshot of the visualization that is still up and running.
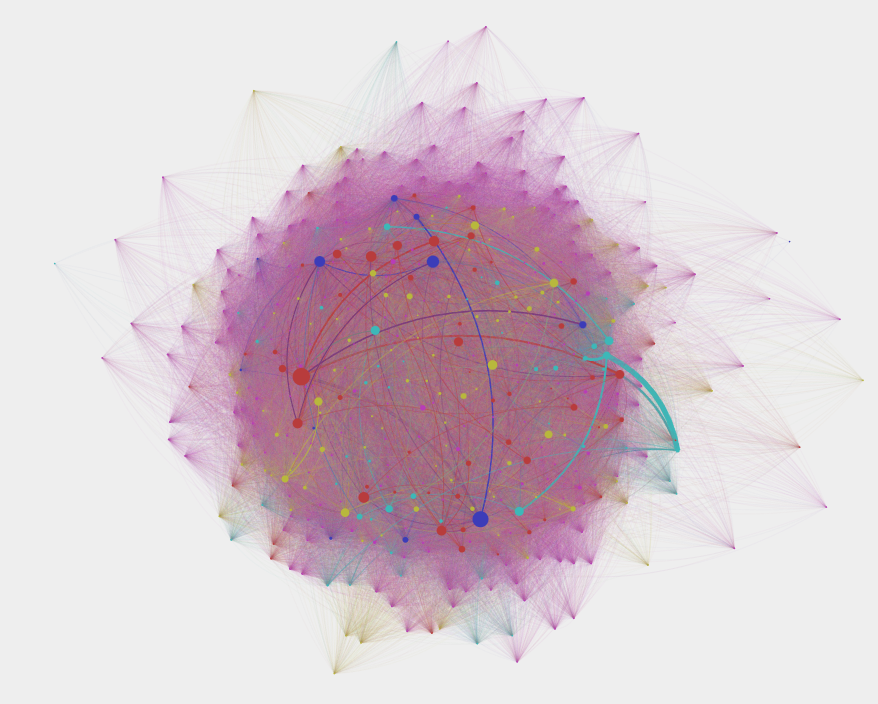
It looks like a pretty star, but zooming in gives a lot of information, which makes more sense if you have context for what is supposed to be displayed.

The planning phase for the project was from 2012-2014. It had updates since at least 2022. It was a project with a massive scope with a long timeline. I am not surprised at the amount of data that was able to be accumulated. This picture above shows 128 connections. The computational algorithm must have been putting in overtime, there were a lot of similarities between a lot of the things written.
Obviously, the sources of data aren’t readily available to the general public. There was some archive information that was obtained from some of the partners that worked with the project.

One of the links that isn’t completely broken has this error when you type something into the search box. One can only hope that the project stays in well enough condition to keep running. If things become lost to time, we will have to ask ourselves how worth it the project really has. It had influence when it was up, but once it is gone, if it disappears, how long will its impact linger?