We’ve talked a lot in this course about messy data and the different benefits of tidy, clean, smart, big, etc. data. As you begin working on your final projects, you’ll no doubt find or create some messy data that will need cleaning. Today, we’ll practice a great tool to do that with, and explore a way to create a timeline visualization with a simple framework that uses a google sheets backend.
Cleaning Data with OpenRefine
OpenRefine is like a spreadsheet program but with extra special features that let you perform batch operations to clean and transform data and turn messy OCR’d or scraped text into nice regular tabular data.
Bar Chart Race
OpenRefine is the program I used to manipulate the data from the Data Vizualization lab to fit the format necessary to create the Bar Chart Race diagram on Flourish.studio below, which some of you also found.
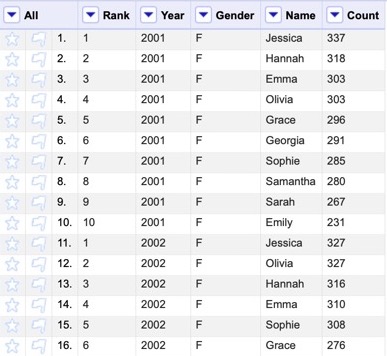
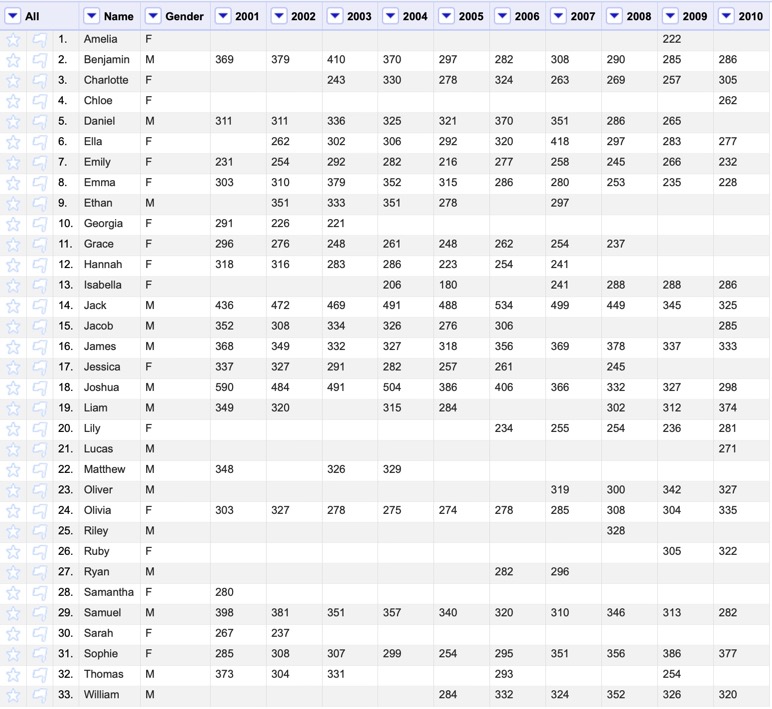
This template wants a dataset with a row for each participant in the race (in this case, each name) with a first column containing the Label, optional Categories (e.g. gender), and each subsequent column representing a “stage” of the race (e.g. a year) that holds the Values (e.g. counts).

So we need to change our data from the format on the left in which we received it, to the one on the right, with one row for each name and counts broken into their own columns, which is how our visualization tools wants it. OpenRefine, will let us do this in a few quick steps.
1. Install OpenRefine
Head to www.openrefine.org/download and download OpenRefine. It’s available for Windows, Mac and Linux
NOTE: If you’re on a Mac and, when you try to open OpenRefine, you get a message saying that you can’t open software from an unidentified developer, do the following: right-click the program and choose Open, then click Open again.
2. Import Project Archive
OpenRefine lets you save a project archive file that contains the data and the Undo / Redo history of all the steps taken to clean your data.
- Download the Project Archive file below that contains the OpenRefine steps I followed to reformat the data for Flourish’s bar chart race.
- Go To Import Project and find the .tar.gz archive file you downloaded above.
- Import and you should see the reformatted data with the full history of actions taken
3. Reformatting data to fit a visualization tool with OpenRefine
Go to the Undo / Redo tab to see the complete history of operations, and return to step 0.
I’ll walk you through the steps I took to get it into Bar Chart format using the following procedures (the links go to the official OpenRefine documentation for each move):
*s denote special cool data cleaning steps that OpenRefine allows that are hard to do elsewhere
- Edit Column > Move column to reorder our columns and get the Name in first place
- *Transpose > Columnize by key/value columns to create new columns holding the counts for each year
- Use Key Column: Year and Value Column: Count
- Sort by Name A-Z and then Sort > Reorder rows permanently to preserve the sort on the Name column
- Edit Cells > Blank down the column Name to get rid of duplicates
- The data are now in Record mode instead of Row, so switch to Show as: records
- We won’t need the Rank column for this visualization, so Edit Column > Remove this column
- For each Year column, Edit Cells > Join multi-valued cells to get all the values on the same line
- Finally, to get rid of the extra Gender values, switch back to Show as: row mode
- On the Name column create a Facet > Text facet to group all like terms
- In the Facet / Filter tab, scroll down and click (blank) to filter for only those rows
- In the All column menu, choose Edit rows > Remove matching rows
- Click Reset All at the top of the Facet / Filter tab and you should see your nicely reformatted data!

Self Directed Exercise: Cleaning Messy Data
These steps just rearranged our data. If we have messier data, OpenRefine’s facets, Clustering algorithms and use of regular expressions really shine at letting us clean up inconsistencies.
We’re going to play around with some messy book illustration data to clean up the date fields so that we can create a digital timeline out of the entries.
1. Work through the steps below to clean a version of the dataset and save it in your drive folder
Here are the data manipulation tasks we will take with OpenRefine
- Clean up spelling inconsistencies
- Remove extra white space
- Format dates and numbers using regular expressions
- Extract and combine values
2. Download our sample data
We are going to be using a sample dataset developed for an “Introduction to OpenRefine,” tutorial developed by Owen Stephens on behalf of the British Library. We will use the same data, but do slightly different things with it today.
Download the data from github here (right click and Save Target as, or open in browser window and Save)
- Save it to your hard drive as a .csv file to import into OpenRefine
3. Clean data in Open Refine
We will help you if you get stuck, but this is what we are going to do, along with some text you’ll need to copy and paste to get going
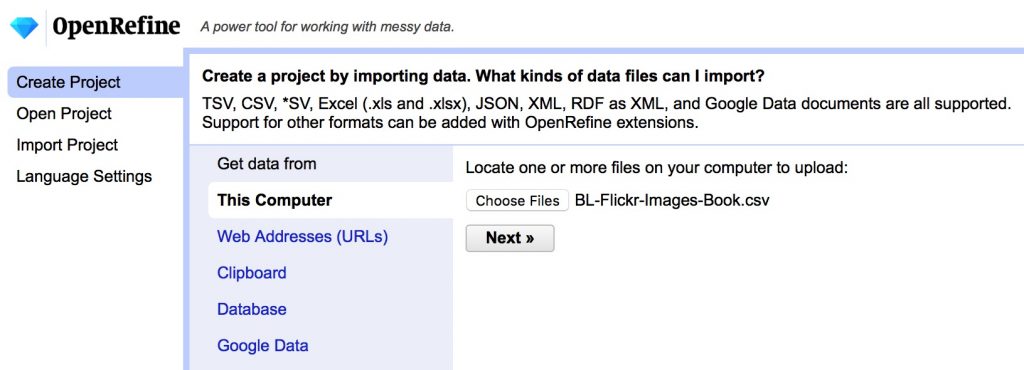
- Create Project and import the data from This Computer, accept the defaults (but consider the options)
3a. Clean inconsistencies in text columns
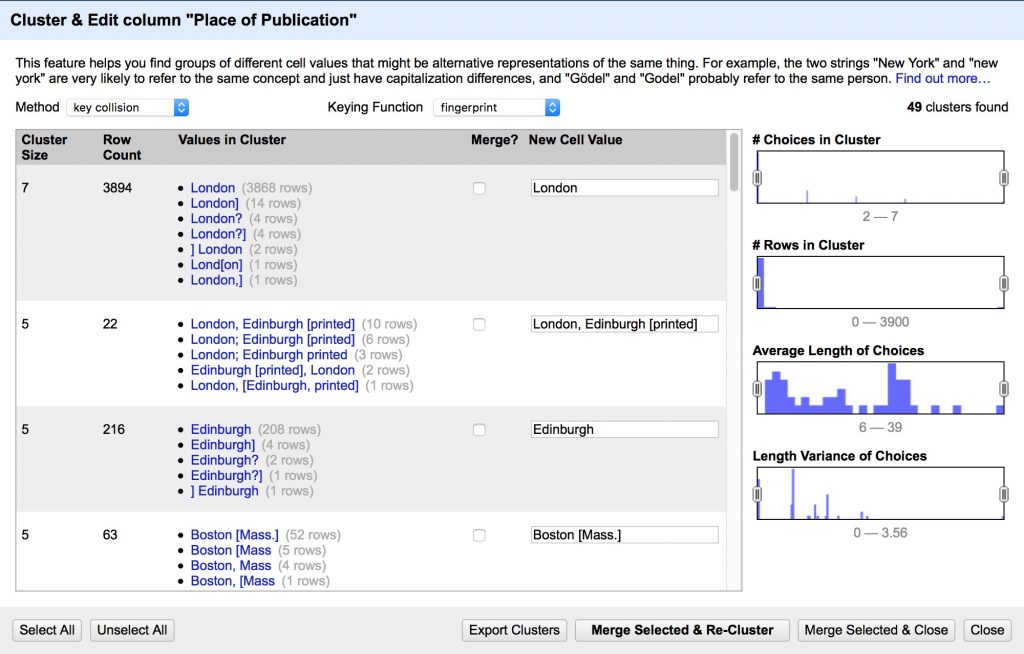
The Place of Publication field is messy and contains many references to the same place with slight spelling and punctuation variations that humans will ignore but computers will be confused by. We’re going to clean them up.
- Create a text facet on Place of Publication field following the image below
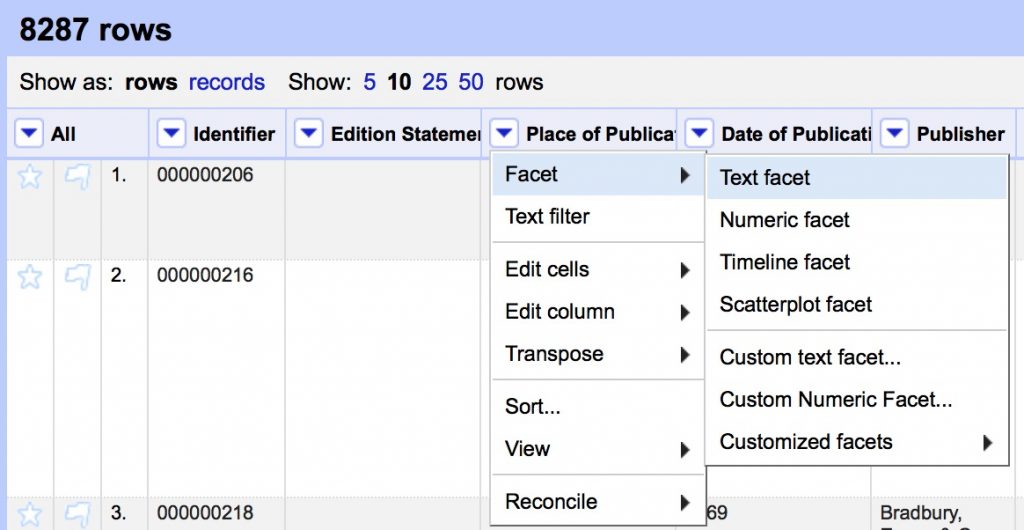
You should see a list of all the unique values with counts of how many times each appears in the dataset. Note the range of strange values in what should be a list of geographic locations. We’ll start to clean them using Open Refine’s powerful clustering algorithms.
- Cluster the Place of Publication facet to clean up inconsistencies
- Review the suggested clusters, choose the best New Cell Value, Merge Selected & Re-Cluster
- Repeat until most clusters are resolved
- Change the Keying Function to another algorithm and see if you can refine further
3b. Clean formatting junk in text columns
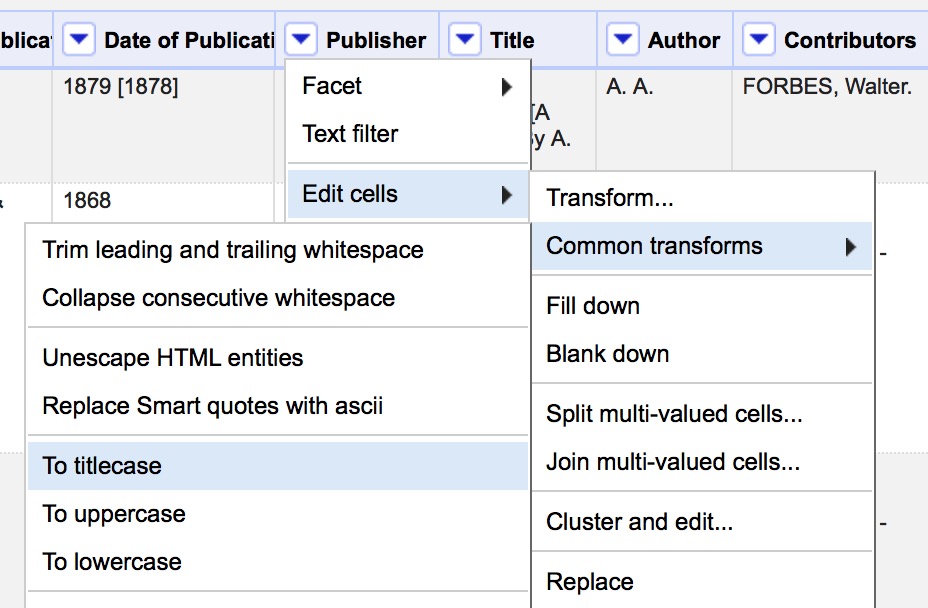
Many computer programs will treat capitalization and whitespace as significant differences, where a human normally would not. We can clean up these errant values using Common Transforms.
- Use Edit Cells > Common Transforms to
- Convert all values in Publisher field to Title Case
- Trim leading and trailing white space
3c. Clean and transform numeric/date data for visualization
In order to plot a time series on dates, or have the computer count numbers, we need to transform our data to valid data types in those fields. OCR’d text often has errant characters that read as text instead of number or date. Let’s fix that using both custom text transformations and regular expressions.
- Create a text facet on Date of Publication
(we can’t use a numeric or timeline facet yet because of all the non number characters in this column “[]?” etc.)- Cluster Date of Publication
- Select All, Merge Selected & Recluster
Now we need to clean up the non-date related characters using regular expressions.
Regular Expressions
Regular Expressions are a fantastically useful tool to match patterns in text to do advanced find, replace, and extract operations. They are implemented slightly differently in many different applications, but here are some general resources to get you started.
- RegExr is a great browser based tool to learn and try out regular expressions, much like paste bin sites like jsBin or CodePen that we’ve used for HTML, CSS and JavaScript
- Understanding Regular Expressions lesson from the Programming Historian
- A great introduction to the power of regex using advanced find and replace in LibreOffice
- Cleaning OCR’d text with Regular Expressions lesson from the Programming Historian
- A next level up in regex use, writing a python script to parse messy OCR’d data
- Regular Expressions cheat sheet from the TextMate text editor
- A handy go to guide for the most commonly used regular expressions
In Open Refine, we’ll use the value.replace() function for this. First we’ll remove the second bracketed date in values that contain two like like: “1879 [1878]”
- On the Date of Publication column, go to Edit Cells > Transform
- Make sure the Language field says General Refine Expression Language (GREL) and copy/paste the following regex expression in the box
value.replace(/\s\[.*\]/,"")
This substitutes nothing (“” the value after the comma) for any value matching the pattern between forward slashes “/” before the comma; in this case:
\s     any whitespace character (space, tab, etc.)
\[     an open square bracket (escaped by the backslash)
.*     any characters (the * means 0 or more of the preceding)
\]     a close square bracket (escaped by the backslash)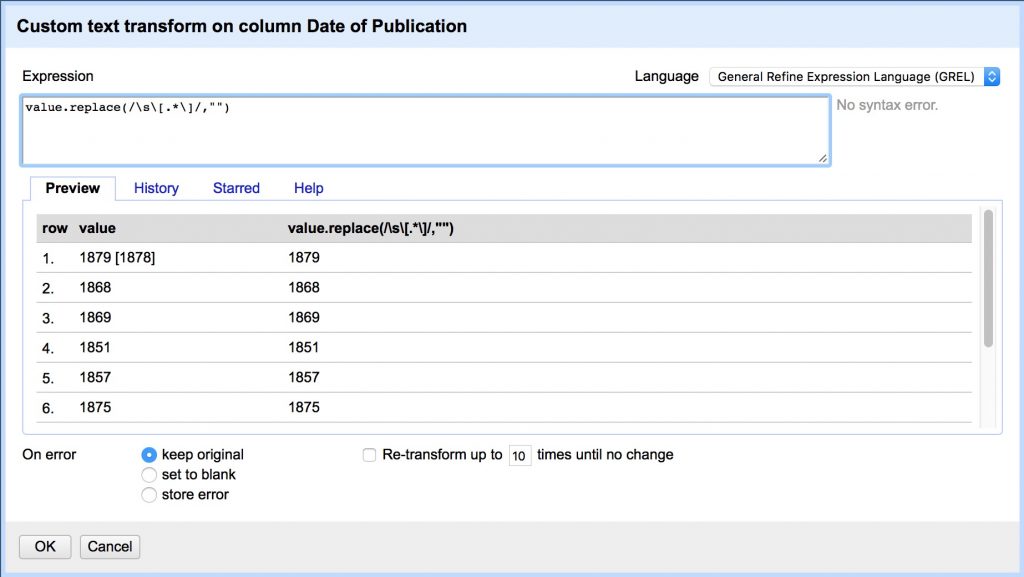
Now lets do it again to remove any of these characters “[].?” wherever they appear individually. We do this by using unescaped square brackets to form a “character set” and match any character within it. Note we have to escape several with backslashes because they have special meaning in regex.
- First, Date of Publication > Sort with options as text, a-z
so that all the bracketed values show up at the top of the list and we can see them in the preview - Date of Publication > Edit Cells > Transform… and copy/paste:
value.replace(/[?\.\[\]]/,"")
[      open character set
  ?      match "?"
 \.      match "." (escaped by the backslash, otherwise means any character)
 \[      match "[" (escaped by the backslash, otherwise opens new set)
 \]      match "]" (escaped by the backslash, otherwise closes new set)
]      close character set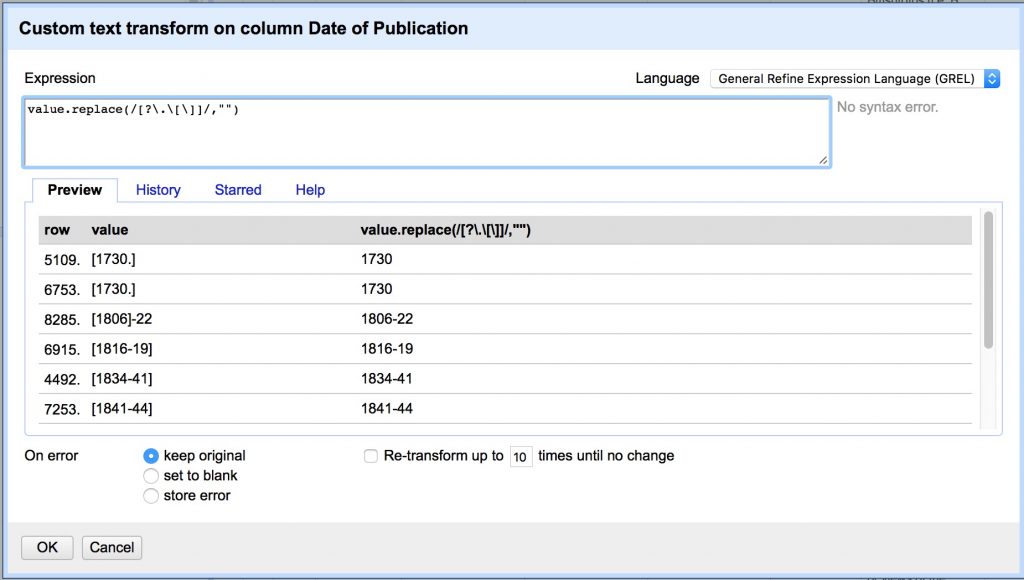
- Sort > Remove Sort to revert to the original order
Some rows contain date ranges, rather than single dates. We would ideally preserve these ranges by making a new End Date column, but the data are messy enough that we will compromise here by making Date of Publication contain only the first full date listed.
We’ll do this by using a capture group to isolate the date. Putting parentheses “()” around a pattern “captures” it and allows you to recall the captured group later, with a numbered variable like $1, $2 for the second captured group, etc.
- Date of Publication > Edit Cells > Transform…
- Copy/paste the following
value.replace(/(\D*)(\d{4})(.*$)/,"$2")
()     capture group for extracting substring or backreferencing
\D*    any character that is NOT a digit (* means 0 or more of preceding)
\d{4}  any digit character 0-9 ({4} quantifier matching 4 of the preceding)
.*$    any character (* means 0 or more) to the end of the line ($)
This regex captures three groups and replaces the current value with only Group 2, referred to in GREL by “$2”.
- Group 1: any non-digit characters at the beginning, e.g. “printed “, “c “, etc.
- Group 2: the first 4 digit date, the value we want to save
- Group 3: any additional characters after that date, e.g. “-1898”, “, 04”, etc.

Finally, we’ll remove any remaining values from the column that are not a simple 4-digit date, using the .match function which returns an array of any captured groups, from which we’ll grab the first value by appending its index number, [0]
- Date of Publication > Edit Cells > Transform…
- Copy/paste the following
value.match(/.*(\d{4}).*/)[0]
()     capture group for extracting substring or backreferencing
.*     any character (* means 0 or more of preceding)
\d{4}  any digit character 0-9 ({4} quantifier matching 4 of the preceding)
.*     any character (* means 0 or more of preceding)
[0]    returns first value in array

3d. Split values and merge columns
Sometimes values end up in the wrong columns, since characters that were supposed to split values — like the comma in a Comma Separated Values sheet — were not recognized.
If you look back at our Place of Publication facet, you’ll see it erroneously contains a number of date values, many of them following commas, while the Date of Publication column contains 183 blank rows missing their dates.
Row 8 of our sheet is one clear example, where the date value is in the wrong column

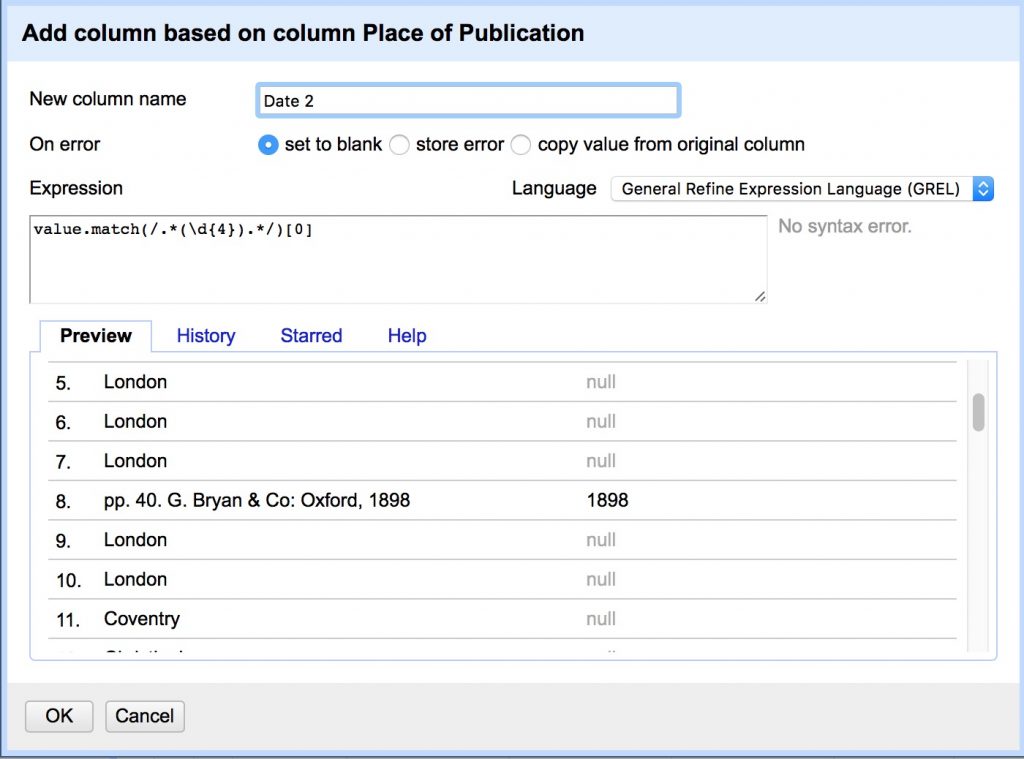
We can use the same .match regex expression above to pull out the date values and put them in a new column, which we can then merge with the existing Date of Publication.
- Place of Publication > Edit Column > Add column based on this column…

- Set the New column name as “Date 2”
- Copy/paste the same regex expression we just used
value.match(/.*(\d{4}).*/)[0]
You should have pulled 184 missing date values out of the Place of Publication! Now we just have to merge them back into our original column.
- In the Date of Publication text facet, click on (blank) to see all matching rows
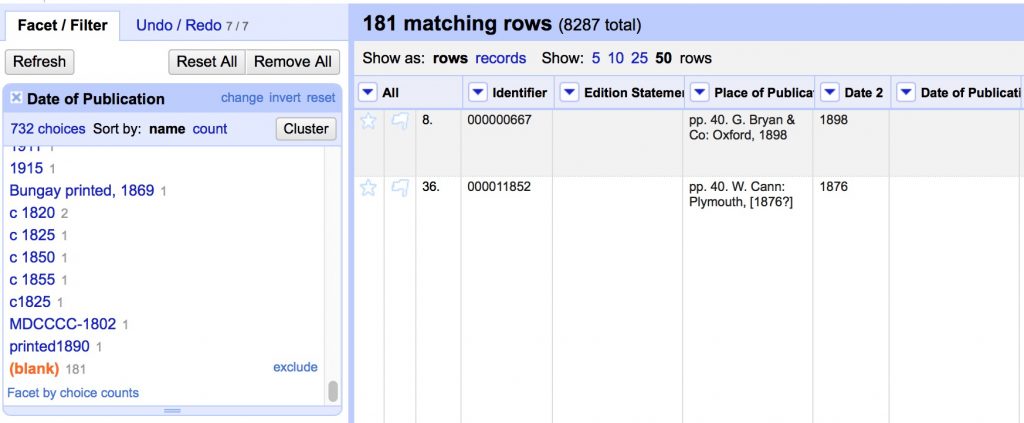
With these rows selected, any transformations we apply will only affect the matching rows and not other values. This time we’ll use the cells object to pull values from one column into another.
- Date of Publication > Edit Cells > Transform…
- Copy/paste the following
cells["Date 2"].value

Almost there! Now we just have to clean up our process mess before we can export.
- Click Reset All in the Facet/Filter tab to restore the view to all values.

And now we can delete the Date 2 column, since it’s values are preserved in Date of Publication
- Date 2 > Edit column > Remove this column
Export from OpenRefine
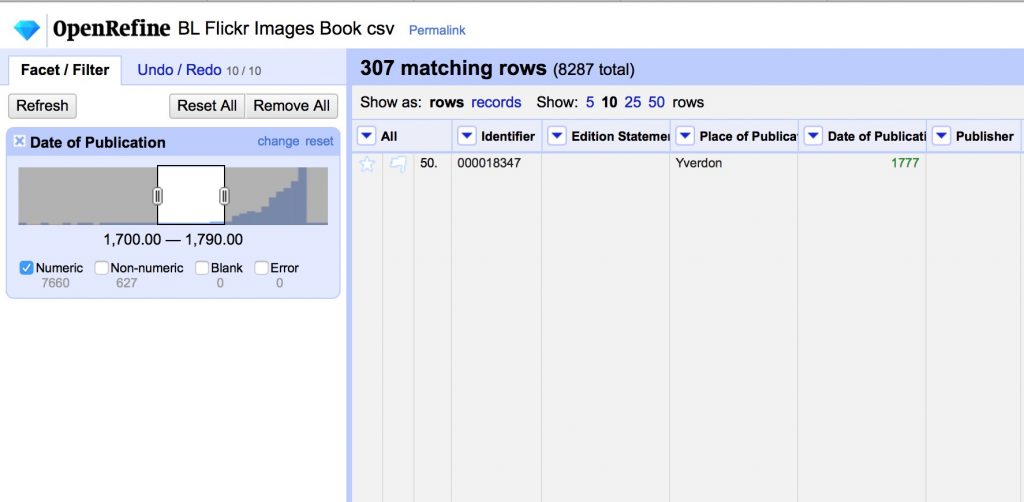
Big datasets are tough to work with, so you can use facets to shrink your dataset. Here we’ll show exporting just the books published between 1700 and 1790, but the same principles apply to any facet you might create.
- Use Edit Cells > Common Transforms > to number on the Date of Publication field
- Use the number facet on the Date of Publication column to select a range, and uncheck Non-numeric and blank.
- Choose Export in the top right, and download as CSV
CONGRATULATIONS!! You’ve cleaned up all the data columns and gotten pretty clean data.
- Save your export in your google drive named folder
Timeline JS Visualization (OPTIONAL)
Now that we’ve used OpenRefine to clean up a dataset of book images from the British Library, we can export that cleaned data and create an interactive timeline visualization with it.
One of the longest-running types of applications is an interactive timeline. We will do a class project to convert our flat spreadsheet into an interactive timeline using an easy to use application, but there are other tools that require more coding and show you how these work. Take a look at the SIMILE timeline tool for an example of one of those.
Open Downloaded Data
First, you’ll need to open your .CSV file that you downloaded from OpenRefine if it’s not still open.
- Sort the data by “publication date” by year
- Select a date range for roughly 10 entries to work with
Matching Data to Framework
One of the biggest challenges of using off the shelf platforms is figuring out how to map your own data onto the framework the app developers have set up. Collectively figure out which data to put where in the TimelineJS template.
- Go to the TimelineJS page and follow the 4 step instructions to Make a New Timeline
- In Step 2, download the Google template save a copy to your folder in our shared Google Drive.
- In Step 4, open the Preview in a new window to see the output as you work on the sheet
- Once you are setup, delete the template data and figure out how to move over your personal date range from the BL Flickr images data set. The dates and captions should come over with an easy copy/paste, but then you’ll probably need to finesse the rest of the data a bit.
- You might need to change the number format of the Date columns to a different date display or even Number > Plain Text to get them to display and order properly
- All entries should have a brief headline that summarizes the text on that date’s card, which you’ll need to write or select a proper column category for
- The linked flicker images no longer work, so you will need to find an image URL online to use for each rows “Media” column.
- Where there are no images, see if you can insert a Google Map if appropriate.
- NB: All Media should have a Media Credit, which will usually be “British Library” or its Shelfmark
- Finally, explore what happens to the timeline when you use tags to categorize events.
OpenRefine Resources
There are a lot of great resources for getting started out there, but here are a few to get you started.
- Miriam Posner’s introduction to OpenRefine
- A basic introduction to the tool, that will give you the key features for working from messy data that is already in a table
- Cleaning data with OpenRefine lesson from the Programming Historian
- A more in-depth exploration including using the GREL language to do more advanced programmatic cleaning
- Fetch and Parse data with OpenRefine lesson from the Programming Historian
- A power application that uses GREL to fetch URLs and parse web content into csv files
More OpenRefine resources from Miriam Posner
Note: Extracting Text from PDF
We are starting with table data here, but many projects will first need to pull data from PDF files using Optical Character Recognition. There are many ways to get OCR’d text out of a pdf, from APIs to python utilities to copy/paste. If you are on a mac, one of the easiest is to set up an automator script to generate output from any PDF you drop on top of the application.
Blog Post Assignment: Final Project 1 — The Pitch (due THURSDAY)
Brainstorm your final project ideas and groups by talking with your neighbors/friends in the class, and beginning to fill out this Google Sheet with ideas.
Form a group of 4-5 and chose or invent a project. Collectively write a blog post on the course blog, stating the following:
- Members of the group
- The definition of the project topic and objectives for what you plan to produce
- The proposed methodology:
- Sources: What data do you hope to use and how do you hope to find it?
- Processes: What tools and techniques will you use to gather sources and store your data?
- What analyses or transformations will you conduct on those data?
- Presentation: How will you present the results and integrate the digital assets you create as an interactive final product?
- The proposed timeline of deliverables
- And finally, a link to one or more DH model projects that you think might make a good precedent for what you plan to do.
Create a unique tag for your group to tag all your posts going forward.
Each member, at the bottom of the post, append a brief message outlining your personal interests in the project and what you hope it will achieve.
Post the link to your group’s SINGLE Project Pitch blog post to moodle before class on THURSDAY (so we can focus on the midterm this weekend)!